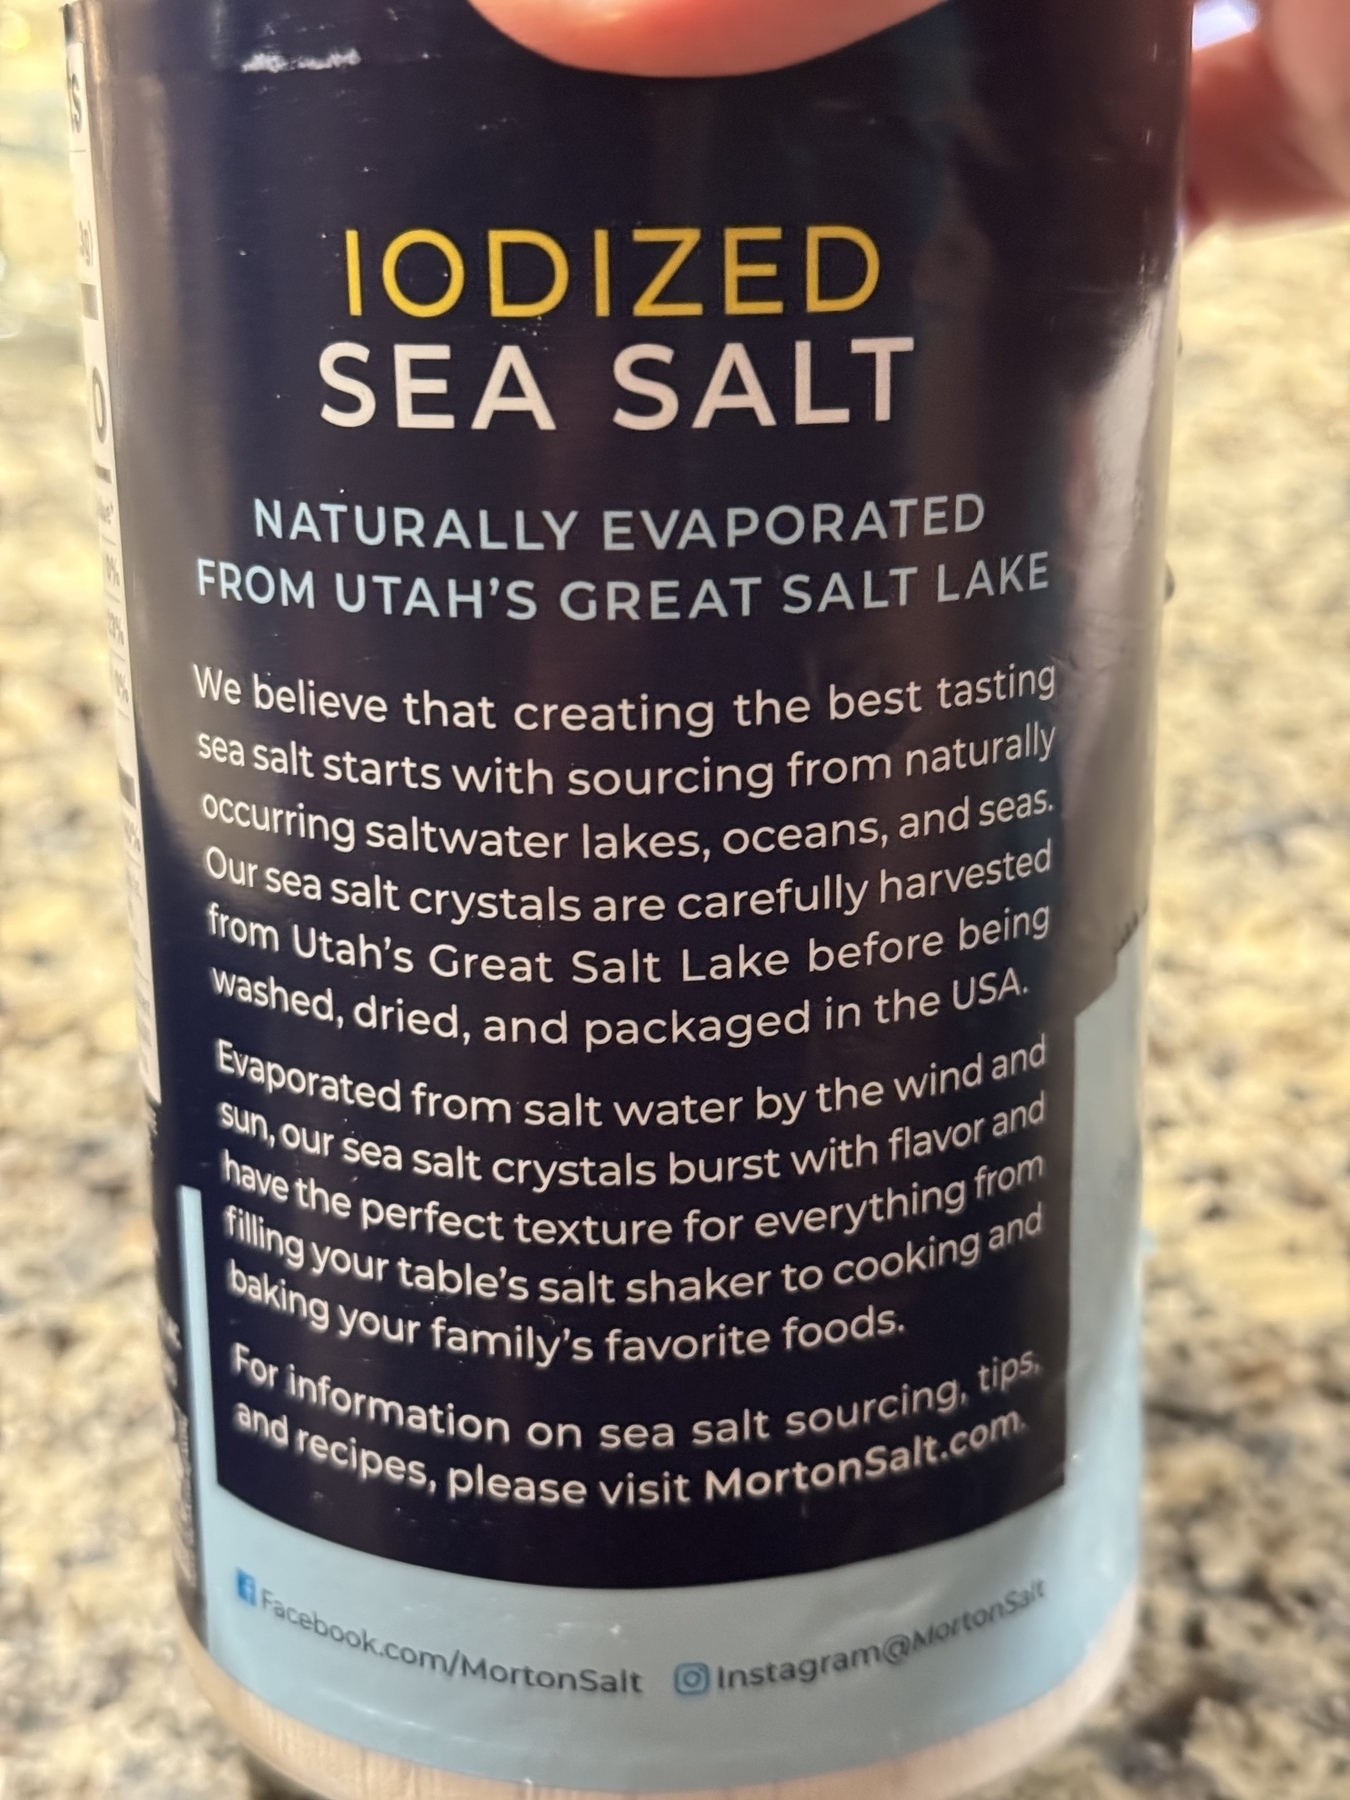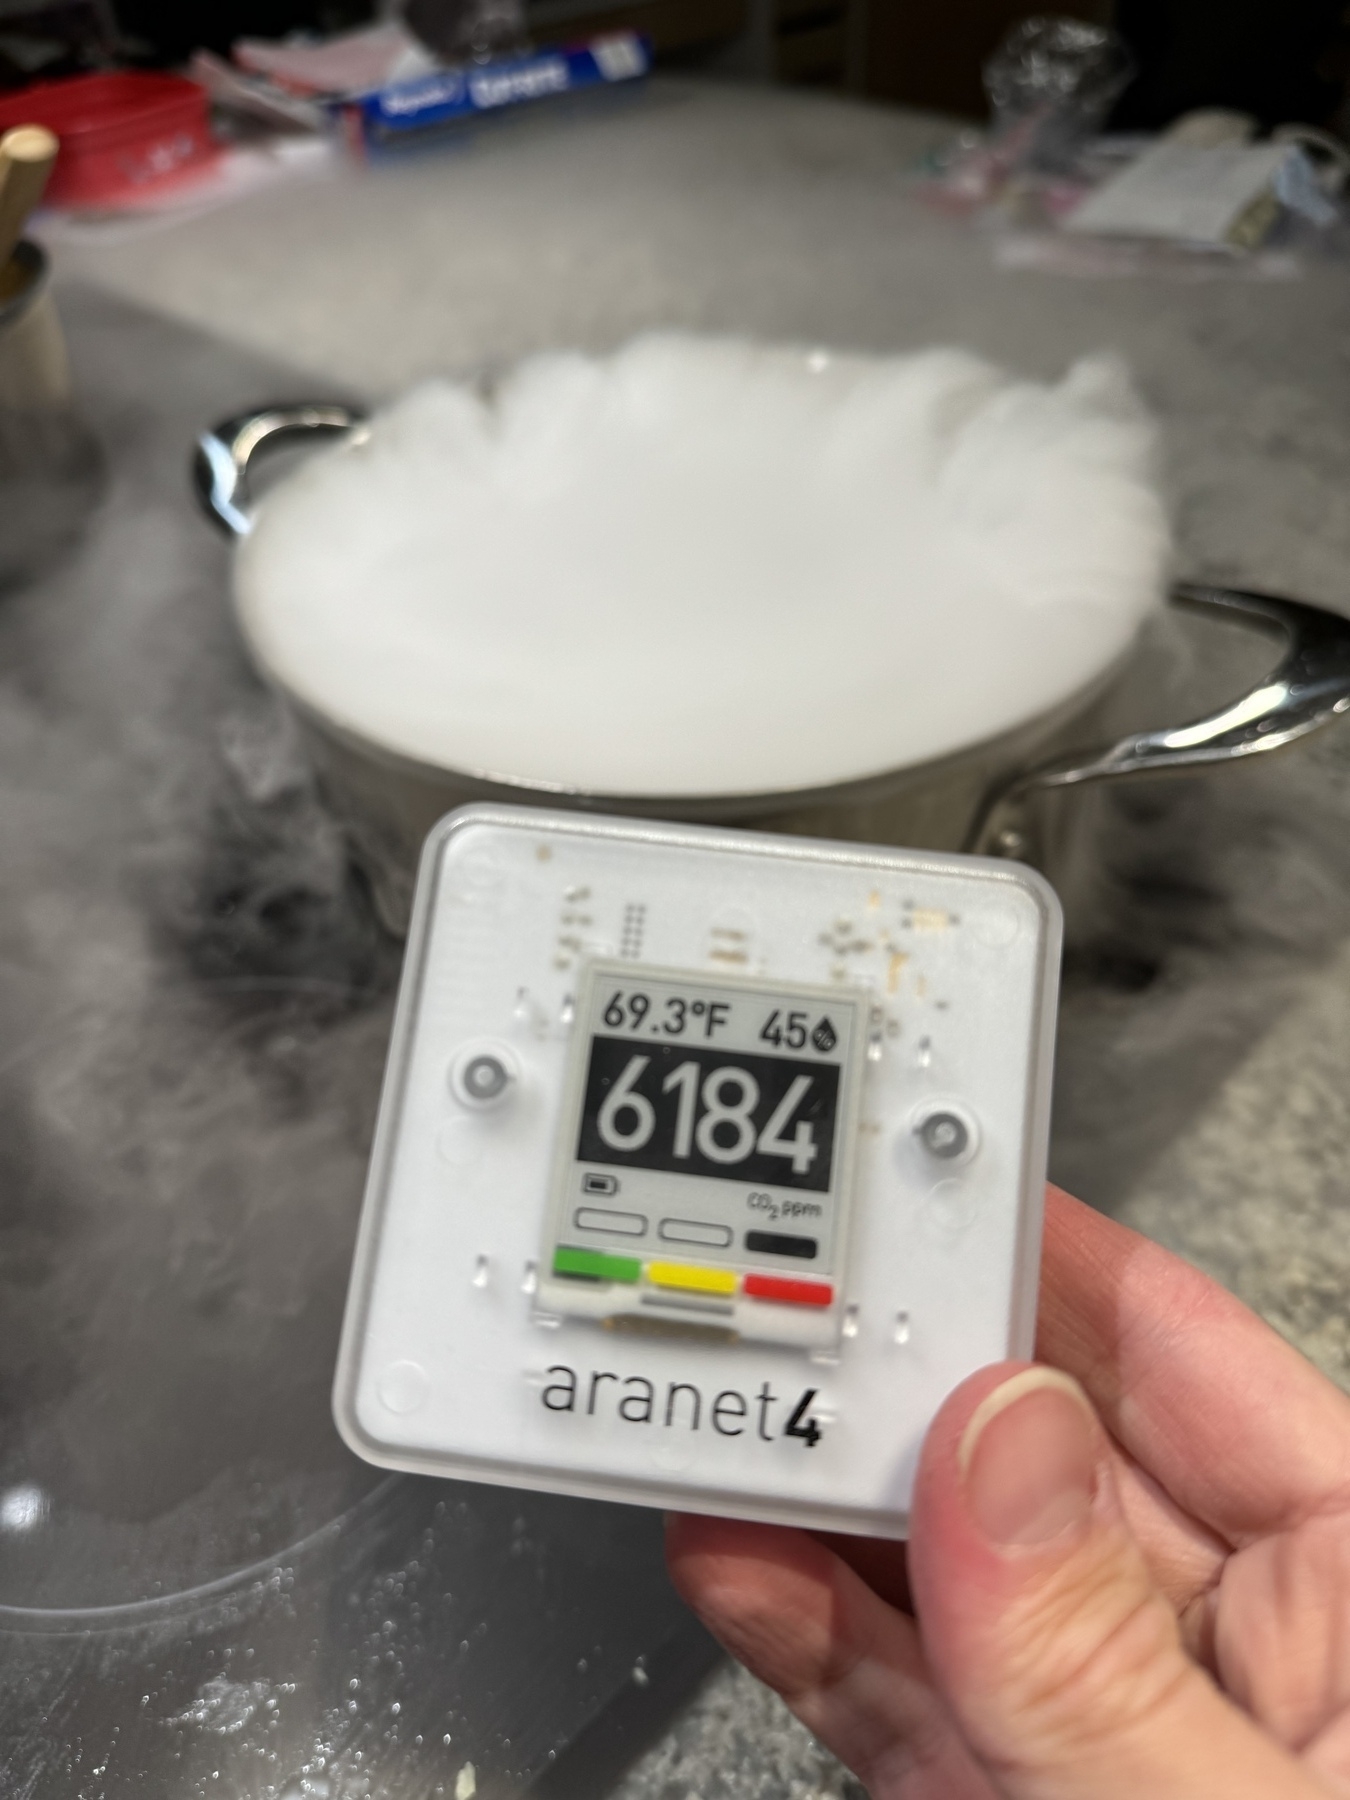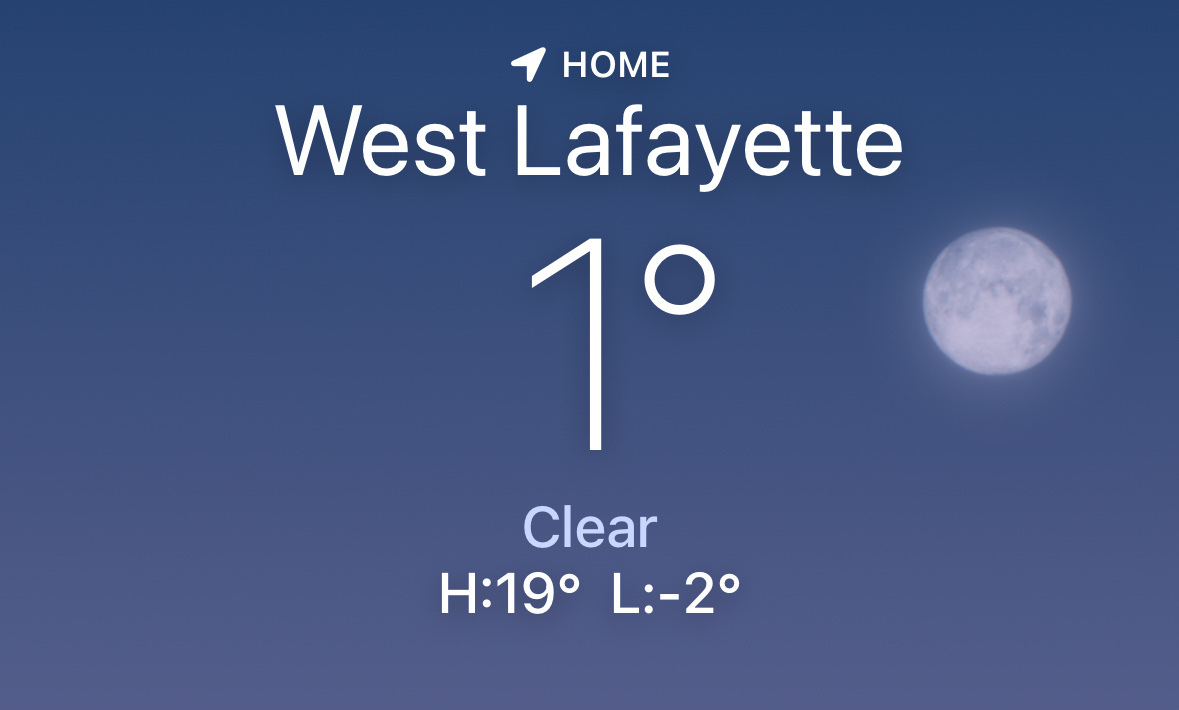
• Homemade tonkotsu ramen tonight.

  • Does anyone know if Apple’s new passwords app (iOS 18/macOS 15) has some way to access the passwords in linux? (e.g. windows client via wine??)

  • Helpful links from a recent trip to Japan!

    www.thetokyochapter.com/kid-frien… Sadly, we didn’t get to eat at any of these :(

    JapanTravelTips on reddit

    Flyertalk form on luxury hotels in Tokyo

  • Why do searches for the phrase “global south” peak in April? trends.google.com/trends/ex…

  • Even ChatGPT failed to help me debug the damn tab problem in a makefile.

  • Why is swift so hard? I just want to read a 30GB gzipped file line by line… this is just a few extra characters in python/julia…

  • In Science: Quantifying methane emissions from US Landfills by Cusworth et al.

    It’s always surprising when you learn that obvious things aren’t being done, or at least aren’t standard. In this case, it’s using the best tools to measure how much methane is coming from landfills. In news that will shock no one, actually measuring this shows that it’s higher than “bottom up modeling” would suggest.

    This is a fairly readable paper in Science. Kudos to the authors.

    The team behind this paper is the carbon mapper team. The required methane emissions test is someone walking around with a flame ionization detector to find hotspots. The team behind this paper hired aircraft with higher resolution sensors that are designed to spot methane in the air through its impacts.

    A key component of their findings relates to higher temporal frequency showing persistent emissions over time.

    Anyway, look around the carbon mapper data to see where the methane is coming from nearby you! In our case, it’s from a few landfills. The team behind this is planning to launch a few satellites to improve the temporal resolution of the data (at the cost of reduced detection thresholds)

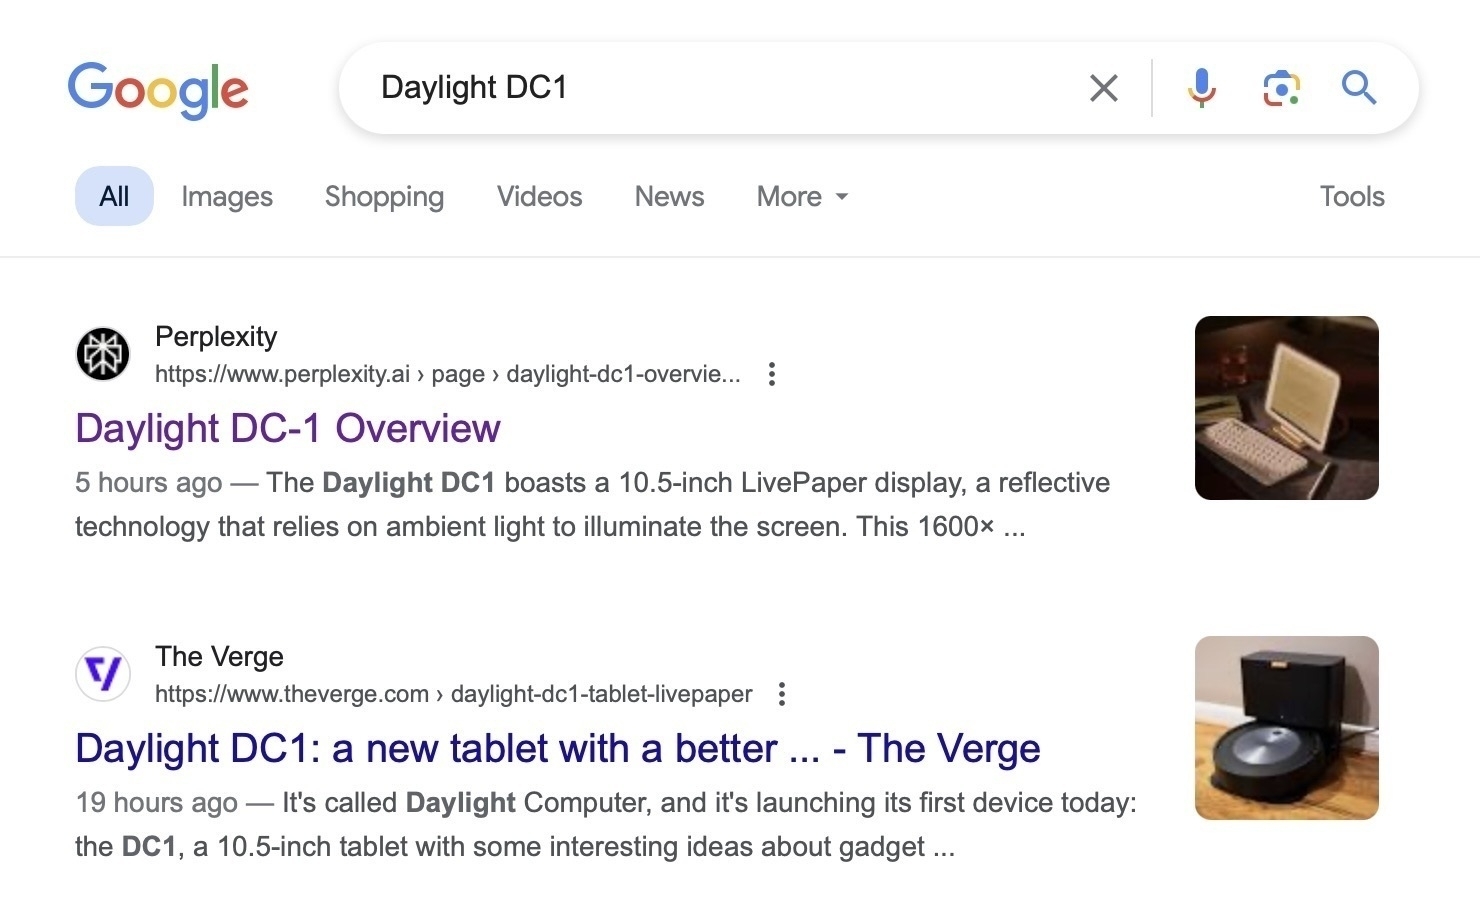
  • This is a bizarre result from Google.

    A screenshot of a google search showing really bad results for the daylight dc1 computer.

    Why is another search engine first? Why is the picture wrong on the second?

    I wanted the kickstarted page.

  • Does anyone else have serious reservations about anonymously sharing code for paper review these days?

  • Observable like plots in Makie.jl

    Use this template to get Observable plot like figures in Makie.jl

    using CairoMakie
    f=Figure(; size=(3*96, 3*96), figure_padding=0) # set padding
    ax = Axis(f[1, 1], alignmode=Outside())
    lines!(ax, randn(10), randn(10), label="Line 1")
    lines!(ax, randn(10), randn(10), label="Line 2")
    lines!(ax, randn(10), randn(10), label="Line 3")
    hidespines!(ax)
    lblt = Label(f[0,1], "↑ Response", 
      rotation=0, halign=:left, valign=:bottom,
      tellwidth=false, fontsize=11,
      alignmode = Outside())
    lblr = Label(f[2,1], "Variable →", 
      rotation=0, halign=:right, valign=:top,
      tellwidth=false, fontsize=11)
    rowgap!(f.layout, 0)  
    ax.xticklabelsize[] = 11
    ax.yticklabelsize[] = 11
    f[-1, 1] = Legend(f, ax, framevisible = false, orientation = :horizontal,
      labelsize=11, padding=0)
    Label(f[3,1], "This could be some explanatory text", halign=:left,
      tellwidth=false, fontsize=11, font=:bold)
    rowgap!(f.layout, 0)  
    f
    
  • This is me…

    A description of a man sitting at a child's bedside where the child asks for a very specific type of story and the man is working on a laptop

  • I think I’m checking the eclipse weather too obsessively. Pivotal weather and windy are nice. Also capital weather gang on twitter. Some of the national weather service. Results for Indianapolis are looking better… nytimes has something, but will it update?

  • yahoo is still around? www.theverge.com/2024/4/2/…

  • Is PyTorch and PyTorch Geometric supposed to take over an hour to install? … tick tick tock and it’s still running …

  • Better than the best low-rank approximation with the SVD.

    It’s February 29th 2024, Gene Golub’s 23rd birthday. Time to do an SVD and talk to a junior colleague. But don’t do a silly SVD example–learn how to level-up your SVD. Using the SVD. (This is a link to YouTube – go watch it!)

    That’s right, you can actually use the SVD itself to do better approximations of data. The key is to reorganize your data. For images, this means using little tiles.

    Checkout the code or read about it on arXiv

  • Dump of a few older things from Science

    Apologies, I forgot to record the

    Soil to Foil I’ve added this book to my reading list. Really interesting book (and I later read it. The end gets a little bit boring, but it’s still worth reading for the history on aluminum)

    If the results of Liu et al. hold up, thermoelectric materials should be an interesting area to watch in the next few years. These would give better ways to cool things down, which is important in power-dense electronics.

    The meta-diary of the Meta+outside analysis of the election is riveting and well-written, and ultimately critical of the effort.

    Just like humans have microbiomes, so do trees, and these make a difference to what happens when the tree is stressed by the environment. Treating this microbiome gives another way to improve tree growth and probably plant growth.

    Standard caveat with Science. These are results are cherry-picked among all the research and consequently have a bias towards incorrect results from the selection process – thus, extra skepticism is warranted.

  • How did I get this as an ad?

  • Impact of coal power on excess deaths.

    There is a nice figure from Mortality risk from United States coal electricity generation regarding the impact of coal generated pm2.5. Initially, I was a little bit skeptical as coal pollution is presumably associated with poverty which has myriad health implications. On the other hand, this figure is very compelling which shows that in a number of cases, total excess deaths decreased after a scrubber was installed. Hard to argue with that data, which is helpfully presented as a rich time series – allowing one to draw that conclusion without being told!

  • Cartel Size Paper in Science

    I just finished reading through the main paper on [Mexican Drug cartel sizes in Science]() (I still really need to read the supplement, which is where all the actual details are…). One of the things I love about Science and Nature is that they will publish “preambles” or “contexualizers” for articles. [In this case, there is a lengthy preamble by Caulkins, Kilmer, and Reuter]() that – I suspect – was the result of a review of this paper that pointed out a number of issues that would be impossible to resolve. In addition to pointing out what seems to be a fairly large hole in the specific justification (e.g. that the result is indeterminate because it’s a ratio), it attacks the entire mathematical modeling edifice itself as too crude an approximation for the complex dynamics involved in cartels “Cartel members are not billard balls or atoms locked into mechanistic reactions to external shocks”. Yet, while this is done with concise and technical precision – the rebuttal is ultimately laudatory and accurate captures the ambition and scope of the effort. It’s nice to see people agree on the utility of big ideas and insights even if they may have huge disagreements on the details – and it’s also nice that Science tries to support this style of debate.

    Now, for my own take, I think the objections to the mathematical modeling have the potential to be overblown. The goal with this type of mathematical modeling is to capture just enough of the truth to be useful. In this case, it seems any more detailed modeling would be impossible to do. e.g. the problem with more complicated agent based models is that it’s hard to know if you have baked in any effect due to the extremely large number of choices they require and establishing the this is not so is often problematic and time consuming.

  • Prediction-powered inference

    New paper in Science on using ML-based methods to improve classical confidence intervals or p-values. (also on arXiv) The idea is to use a large collection of unlabeled data along with an ML method to estimate labels on the unlabeled data. Then we can use that data to improve the confidence interval given all the data. This reduces the amount of data you need to make a key “discovery” as shown in Table 2.

    Code is helpfully available!

  • Light reading...

    I reviewed a book proposal for Cambridge University Press. They often gift books to people who do this, which I love. While I was looking at their catalog, “Quantum Mechanics: A mathematical introduction” by Larkoski (of SLAC), caught my eye. It’s supposedly a quantum mechanics course based on linear algebra.

    It’s been a while since I’ve read a preface that makes me fairly convinced I’ll enjoy a technical book. The perspective articulated is exactly the kind of derivation and analysis I enjoy and learn best from. It’s technical and explanation towards a goal. Supported by simple methods.

    The first few chapters have been fun to read. Although, this is material I know fairly well, so we’ll see how things go once the depth picks up.

  • I love YouTube sometimes! youtu.be/etnMr8oUS…

  • Does anyone know where the (Research Question) RQ1…RQ4 motif / meme in papers originated and/or looked at why it’s gotten very popular recently?

  • Super cool paper by @keenanisalive et al www.cs.cmu.edu/~kmcrane/… By coincidence… I had just been looking at repulsive edges for 3d graph layout for some other stuff. Will try and check this out when I get a moment.

  • No app! Please don’t ever play “1 Hour Deep Sleep Music: Deep Sleep Relaxation” on random shuffle. Never never never never… Just because I played it once while trying to have a calm moment does not mean it should appear on random shuffle!

subscribe via RSS